



Disclaimer: Early release articles are not considered as final versions. Any changes will be reflected in the online version in the month the article is officially released.

Author affiliation: Colorado Department of Public Health and Environment, Denver, Colorado, USA
Seasonal influenza A and B viruses cause significant illness and death annually (1,2). During the early 2025–26 influenza season, an antigenetically drifted influenza A(H3N2) strain, known as subclade K, emerged with reduced antibody binding to contemporaneous vaccine strains (3,4). The emergence of subclade K was correlated with early seasonal influenza activity observed in several countries (5). Colorado was among 3 states in the United States to observe early influenza activity based on outpatient respiratory illness reported to ILINet (6). By the week ending November 22, 2025, Colorado reported high activity.
The Colorado Department of Public Health and Environment supplemented conventional surveillance, including hospitalization rates, clinical specimen sequencing, and wastewater detection using digital PCR (dPCR), with wastewater sequencing for genetic surveillance. We sequenced the influenza A virus hemagglutinin (HA) gene from wastewater and assessed its added value for monitoring influenza trends during the respiratory illness season.
Hospitalization Cases
Figure 1
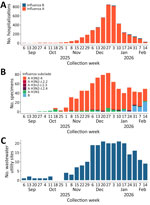
Figure 1. Comparison of hospitalizations, clinical specimens sequenced, and wastewater detection in study of early-season detection of influenza A(H3N2) subclade K in wastewater, Colorado, USA, 2025–2026. A) Influenza hospitalizations of influenza A…
Colorado requires the reporting of influenza-associated hospitalizations. We retrieved data for influenza-associated hospitalizations with admission dates of September 1, 2025–February 14, 2026, from the statewide surveillance system. During that period, Colorado recorded 4,426 influenza A–associated hospitalizations and 110 influenza B–associated hospitalizations. Cases began increasing the week ending November 25, 2025, and peaked the week ending December 27, 2025 (Figure 1, panel A).
Clinical Sequencing
The state laboratory received up to 5 influenza A–positive clinical specimens weekly from hospitals of both inpatient and outpatient cases participating in the statewide influenza sentinel surveillance system. We subtyped specimens and sequenced those meeting sequencing criteria (Appendix); we sequenced 812 specimens during September 1, 2025–February 14, 2026. Of those specimens, 720 (89%) were influenza A(H3N2). Of those samples, we characterized 704 (98%) as influenza A(H3N2) subclade K (hereafter, subclade K) (Figure 1, panel B). The first sample characterized as subclade K was collected on October 12, 2025. Colorado’s right-size target is 50 samples per week to confidently provide situational awareness; we reached that threshold the week ending December 6, 2025.
Wastewater Detection
Established in 2020, the Colorado Wastewater Surveillance Program monitors wastewater across the state for respiratory viruses and emerging pathogens using dPCR (7). The state laboratory received samples 2×/week from 21 sentinel wastewater treatment facilities. We retrieved wastewater detection data for September 1, 2025–February 14, 2026. We detected and quantified influenza A, influenza A H1, and influenza A H3 by using previously described methods (M.C. Hetherington-Rauth et al., unpub. data, https://doi.org/10.1101/2025.10.15.25338105) (Appendix).
We defined the limit of detection by dPCR as the presence of 1 positive partition. We refer to the limit of quantification by dPCR as 1,200 gene copies (gc)/L. Concentration values calculated that fall below the limit of quantification can be interpreted to mean that target genetic material was present but cannot be accurately quantifiable. Concentration values recorded as 0 /L indicate no positive partitions were observed. The number of sewersheds with influenza A viral concentration above our limit of quantification began increasing the week ending November 8, 2025, and peaked the week ending December 20, 2025, mirroring influenza hospitalization trends (Figure 1, panel C).
Figure 2
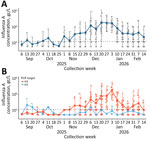
Figure 2. Influenza A viral concentration in wastewater in study of early-season detection of influenza A(H3N2) subclade K, Colorado, USA, 2025–2026. A) Influenza A target concentration. Blue points and connecting lines show…
The average viral concentration of influenza A in wastewater peaked the week ending December 27, 2025 (Figure 2). Influenza A H3 average viral concentrations mirrored the average influenza A viral concentrations. Influenza A H1 average viral concentrations remained low at or below the level of quantification.
Wastewater Sequencing
Figure 3
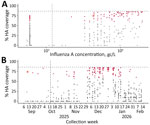
Figure 3. Wastewater sequencing metrics in study of early-season detection of influenza A(H3N2) subclade K in wastewater, Colorado, USA, 2025–2026. A) Percentage coverage of HA gene plotted against influenza A viral concentration….
The state laboratory sequenced the HA gene from wastewater samples using previously described methods (M.C. Hetherington-Rauth et al., unpub. data, https://doi.org/10.1101/2025.10.15.25338105) (Appendix). We sequenced 649 samples collected during September 1, 2025–February 14, 2026. Of the samples sequenced, 112 (17%) met the 60% coverage threshold of the HA gene required for deconvolution (subclade characterization and abundance estimation) (Appendix). We observed that influenza A viral concentration in wastewater was moderately correlated with percent coverage of the HA gene (0.66 Spearman correlation coefficient) (Figure 3, panel A).
We first identified subclade K in wastewater from a sample collected on September 11, 2025; we detected subclade K by clinical sequencing 31 days later (Figure 3, panel B; Appendix Figure). The sample had 74.4% coverage of the HA gene; subclade K was detected at 100% relative abundance. (Coverage is the percentage of the reference gene sequenced at 10× depth; abundance is the estimated relative frequency of the subclade in the sample.) Viral concentration of influenza A in the sample was 4,300 gc/L. After the initial detection, we observed subclade K at near 100% abundance in nearly all wastewater samples meeting the 60% coverage threshold. We detected subclade J.2.4 in 2 samples at 11% and 10% abundance and subclade J.2.3 in 3 samples at 83%, 64%, and 12% abundance. We observed subclade J.2 and J.2.1 at
We assessed the value of wastewater sequencing alongside hospitalization data, clinical sequencing, and wastewater viral quantification to track influenza trends during the respiratory illness season. During the early 2025–26 influenza season, wastewater viral concentration trends mirrored hospitalization trends. The characterization of wastewater and clinical samples revealed that the rise in cases correlated with the emergence of subclade K. Using wastewater sequencing, we detected subclade K 31 days earlier than in clinical samples. Furthermore, the detection of subclade K in wastewater samples with influenza concentrations below the limit of quantification by dPCR demonstrates the high sensitivity of wastewater sequencing.
In addition to earlier detection, wastewater sequencing captures asymptomatic and less severe cases, as well as cases from underserved communities and persons who do not seek medical care, compared with conventional genetic surveillance systems that rely on specimens from hospital case-patients (8,9). Although wastewater samples inherently provide aggregate population-level data, they are subject to factors including the number of infected persons and population mobility, such as tourism and travel between work, home, and school. To clarify how those factors could affect the interpretation of wastewater data, especially for local public health response, future studies could compare clinical and wastewater data at finer geographic scales.
Integrating wastewater sequencing into existing surveillance systems provides an innovative approach to monitor genetic variation, especially early in an influenza season when clinical specimens are typically scarce. Genetic characterization of the virus is integral to monitoring antigenic drift, antiviral resistance markers, vaccine drift, and mutations in primer/probe binding regions of diagnostic assays at national scale. Early characterization of genetic changes of influenza virus through wastewater sequencing can strengthen public health action and reduce response time.
Ms. Hetherington-Rauth is the lead bioinformatics scientist in the genomic surveillance program at the Colorado State Public Health Laboratory. Her primary research interest is the integration of genomic data from clinical and wastewater samples to better understand the evolution and genomic epidemiology of respiratory viruses.
All sequence reads were deposited in the National Center for Biotechnology Information Sequence Read Archive (BioProject PRJNA1458849, accession nos. SRR38394854–5502). All human sequences have been removed from the sequencing reads.
This project was made possible through funding provided under the Epidemiology and Laboratory Capacity for Prevention and Control of Emerging Infectious Diseases (ELC) Cooperative Agreement (no. CK24-0002), Project D: Advanced Molecular Detection, Project F: National Wastewater Surveillance System to the Colorado Department of Public Health and Environment, and Project J: Viral Respiratory Disease Surveillance.