


Disclaimer: Early release articles are not considered as final versions. Any changes will be reflected in the online version in the month the article is officially released.
Author affiliation: Centers for Disease Control and Prevention Atlanta, Georgia, USA (E. Billig Rose, M.K. Steele, B. Tolar, Z. Cui, R.L. Lindsey, J. Chen, H. Carleton, B.B. Bruce); US Food and Drug Administration, College Park, Maryland, USA (J. Pettengill, M. Batz, M. Bazaco); US Department of Agriculture, Washington, DC, USA (B. Tameru, M. Simmons, D. Posny)
Salmonella enterica bacteria are a leading cause of foodborne illness and hospitalization in the United States (1). Improving our understanding of the sources and transmission vehicles of salmonellosis can guide prevention strategies and policy measures to reduce the prevalence of disease attributable to this pathogen. Exposure to Salmonella bacteria can occur through food, drinking water, animal contact, environmental sources such as soil and water, and infected persons (2). Some Salmonella serotypes are highly host-specific. For example, S. enterica serovar Dublin is primarily associated with infections in cattle and sheep, whereas serovar Gallinarum is almost exclusively associated with infections in poultry. In contrast, other serotypes, such as serovars Enteritidis and Typhimurium, are associated with infection of a wider range of human and animal hosts (3–5). Most Salmonella infections in the United States are most likely transmitted through food, especially the commonly observed serotypes, including Salmonella Enteritidis, 4,[5],12:i:-, Newport, Javiana, and Typhimurium (1,2).
Source attribution is the process used to ascribe human infections to specific sources. Attribution estimates can be made for different points in the farm-to-fork continuum, depending on the data and methods used, which can affect interpretation of results. Outbreak-based attribution estimates reflect foods as consumed and might not reflect risks at other points in the farm-to-fork continuum. Data from foodborne outbreaks often are used to estimate the relative contribution of food sources to an attribution estimate for all human infection (both sporadic infections and infections linked to outbreaks) (6). However, only 5% of Salmonella illnesses can be linked to known outbreaks, so these analyses might not be representative of the risks associated with sporadic (e.g., nonoutbreak) illnesses (7).
Other methods can attribute illnesses at points in the continuum before consumption, such as using microbial subtyping to link clinical isolates from sporadic human cases to isolates from food, animals, and other potential sources (8,9). Until recently, most of these analyses were based on traditional laboratory typing methods. With the advent of whole-genome sequencing (WGS) as a subtyping method, developing source prediction models that are based on a more discriminatory subtyping method with publicly available surveillance data has the potential to clarify the source of Salmonella infections and improve attribution estimates.
Machine learning algorithms that use WGS have been shown to successfully attribute human infections to sources (10–14); however, those studies were based on a small number of isolates and serotypes. For our study, we applied a random forest machine learning classifier algorithm to determine the most likely sources responsible for human salmonellosis cases in the United States overall and for serotypes commonly associated with illness. Random forest algorithms are a supervised machine learning classification method that use highly dimensional data (i.e., many predictor variables) to predict membership to a predetermined set of categories. We developed a random forest model by using WGS data of Salmonella isolates with known food sources to estimate the distribution of sources of human Salmonella infections.
WGS Data from Known Food Sources for Model Training
We compiled all available Salmonella isolates collected from food or cecal samples collected from food animals at slaughter in the National Center for Biotechnology Information (NCBI) database (accessed in 2018) and publicly available metadata, plus additional metadata available from the US Department of Agriculture’s Food Safety and Inspection Service (USDA-FSIS), Food and Drug Administration (FDA), and Centers for Disease Control and Prevention (CDC). We then manually identified isolates that could be definitively categorized into 1 of 15 analytical categories in the Interagency Food Safety Analytics Collaboration (IFSAC) scheme (https://www.cdc.gov/ifsac/php/projects/food-categorization-scheme.html) (15). Those categories included beef, chicken, dairy, eggs, pork, nuts/seeds, fruit, shellfish, fish, turkey, vegetables, grains/beans, game, other poultry, and other meat. Isolates from dishes or foods with ingredients in multiple categories were excluded (e.g., lasagna). Because most Salmonella isolates available in NCBI were collected from chicken, we randomly selected a subset of 50% of those chicken isolates to mitigate class imbalance. To further mitigate the effects of class imbalance, we used inverse class weighting to build the model. To ensure our dataset did not contain duplicated isolates, we only included isolates whose sequence read archive identification number was found in NCBI’s Pathogen Browser. In addition, if multiple isolates were associated with the same strain (i.e., specimen) identifier, we removed those isolates from the dataset. This process resulted in a total of 18,661 isolates (Table 1).
WGS Data from Human Infections with Unknown Source
We collected Salmonella isolates submitted to the Foodborne Diseases Active Surveillance Network (FoodNet) during 2014–2017 with unknown source of illness and no history of international travel for the affected patient. FoodNet conducts population-based active surveillance for laboratory-confirmed enteric infections, including those caused by Salmonella, and has a catchment covering ≈15% of the US population (16). During 2014–2017, data were collected at 10 sites: Connecticut, Georgia, Maryland, Minnesota, New Mexico, Oregon, Tennessee, and select counties in California, Colorado, and New York. FoodNet collects data on patient demographics, clinical information, outbreak association, and international travel history in the 7 days before illness onset. Since 2014, FoodNet also has collected data on various exposures, including consuming meats, fruits, and vegetables, during the 7 days before illness onset.
Whole-Genome Multilocus Sequence Typing Data
We assembled food isolate sequences in SPAdes, then analyzed them in BioNumerics version 7.6 (bioMérieux, https://www.biomerieux.com) to assign assembly based allele calls in the Salmonella whole-genome multilocus sequence typing (wgMLST) scheme (17). We assembled human isolate sequences by using SPAdes (https://github.com/ablab/spades), and we generated allele calls from the PulseNet Salmonella wgMLST allele database. Given the time over which the sequence data were generated, we used multiple versions of SPAdes to account for upgrades in the software, the oldest version being SPAdes version 3.7.1. We analyzed the annotated data by using BioNumerics version 7.6. We generated serotype data for each sequence by using SeqSero2 (https://github.com/denglab/SeqSero2). We described results for Salmonella overall and by common serotypes, including Salmonella Enteritidis, Typhimurium, Javiana, Newport, Infantis, Heidelberg, and 4,5,[12]:i:-.
Random Forest Algorithm
We trained a random forest model by using wgMLST data on isolates from 15 known single food categories (18). We excluded loci that were missing allele call information in >99% of isolates. Otherwise, we treated a missing allele as a unique nominal value. We defined tree splits once by using the first principal component of the weighted covariance matrix, which is computationally efficient for nominal features with a large number of levels (19). We evaluated feature importance (i.e., how informative each locus was for accurately predicting food source) by using permutation importance on 2-fold cross-validation (20). We calculated the relative importance of each feature and then ran the random forest with inverse class weighting and 1,000 trees 20 times on a stratified random 75–25 train-test split of the data by using the top-10 loci. We calculated the mean accuracy and κ of the test data by using this top set of features. We repeated this approach, increasing the top set of loci by 50 each time, and finally with all loci present in >1% of isolates. We then determined an optimal model as the one with maximum median accuracy and κ. We assessed the confusion matrix and accuracy for specific common serotypes of interest on the optimal model. We then assessed out-of-bag accuracy overall and by food category.
We applied the trained model to human isolates of Salmonella with an unknown source. For each isolate, if the maximum predicted probability for a food category was >0.50, we assigned the isolate that category as the likely source. If the largest predicted probability was <0.50, we assigned the isolate a class of unknown or nonfood source. We then renormalized the distribution of predictions among human isolates assigned to a category, so the predicted percentages of isolates from each of the 15 categories totaled 100%. We estimated the distribution of sources of isolates from human illnesses overall and by the common serotypes, including Salmonella Enteritidis, Typhimurium, Javiana, Newport, Infantis, Heidelberg, and 4,5,[12]:i:-.
We performed all analyses in R version 4.1.1 (The R Project for Statistical Computing, https://www.r-project.org). We developed the random forest model by using the ranger package (21).
WGS Data from Known Food Sources for Model Training
We trained the random forest model on 18,661 isolates, of which 16,756 (89.7%) were single food sources and 1,905 (10.2%) were cecal samples from food animals (Appendix 1 Table 1). In this analysis, we assumed the cecal isolates were representative of a food source. We included isolates from all over the world; however, most isolates (76%) were collected in the United States. Among isolates with a known year of collection, 603 isolates (3.2%) were collected before 2003, 8,409 (45.3%) were collected during 2003–2013, 9,038 (48.7%) were collected during 2014–2017, and 505 (2.7%) were collected after 2017. Sample collection year was not available for 106 isolates (0.6%).
Figure 1
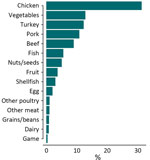
Figure 1. Percentage of Salmonellaisolates collected from known single source foods in the United States and other countries from 2003–2018 (used as training data in random forest model), by food…
Chicken was the most common food source (n = 5,833 [31.3%]), followed by vegetables (n = 2,390 [12.8%]), turkey (n = 2,288 [12.3%]), and pork (n = 2,026 [10.9%]) (Figure 1). We accounted for the skewed distribution observed in the training data across 15 categories during the random forest model development by using inverse class weighting, a cost-sensitive approach to classification on imbalanced data. The most common serotypes were Salmonella Kentucky (n = 1,604 [8.6%]), Typhimurium (n = 1,539 [8.2%]), Enteritidis (n = 1,311 [7.0%]), and Heidelberg (n = 1,280 [6.9%]) (Appendix 2 Figure 1). A total of 22,457 chromosomal loci were present, including 3,002 core loci and 8,143 loci that were present in >1% of isolates (Appendix 2 Figure 2). Among those loci, the number of unique alleles within a locus (that also were missing as a unique value) ranged from 2 to 5,509. The median number of unique alleles was 134 (interquartile range 28–465).
WGS Data from Human Infections with Unknown Source
For food source prediction of human isolates, we used 6,470 isolates collected from humans in cases where the source of illness was unknown and no history of international travel was reported. Isolates were collected during 2014–2017; a total of 280 isolates (4.3%) were collected in 2014, 833 (12.9%) were collected in 2015, 2,429 (37.5%) were collected in 2016, and 2,928 (45.2%) were collected in 2017. Most isolates were not associated with an outbreak (88%). The most common serotypes among the human isolates were Salmonella Enteritidis (n = 1,446 [22.3%]), Typhimurium (n = 716 [11.1%]), Newport (n = 706 [10.9%]), Javiana (n = 553 [8.5%]), and 4,[5],12:i:- (n = 416 [6.4%]) (Appendix 2 Figure 1).
Permutation Importance and Model Performance
The accuracy of the median test data model, when applied to a stratified 75–25 split of the food data with permutation importance and inverse class weighting, ranged from 0.51 using the top-10 loci to 0.74 using the top-7,360 loci (Appendix 2 Figure 3). Of these 7,360 loci, 2,987 were core (Appendix 1 Table 2). The median κ was maximized at 0.70 using the top 7,360 loci; we selected that model as the optimal model.
Figure 2
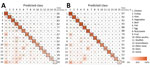
Figure 2. Confusion matrix from the random forest model trained on Salmonellaisolates collected from single food categories in the United States and other countries from 2003–2018 and 613 isolates collected…
The confusion matrix displays the accuracy among each class and patterns of misclassification among training isolates using out-of-bag estimates (Figure 2, panel A; Appendix 2 Figure 4, panel A). The overall accuracy of the model using all isolate predictions was 0.81 (Table 2). The model performed best for chicken (0.95 out-of-bag accuracy) and also performed well for other common sources of Salmonella, such as turkey (0.88), pork (0.83), vegetables (0.82), and beef (0.77). The model had lowest accuracy for less common sources; those with <0.40 accuracy included game (0.10), dairy (0.29), and other meat (0.39).
When we assessed out-of-bag estimates while limiting analysis to the 14,888 isolates with a maximum predicted probability from a single class of >0.50, the overall accuracy increased to 0.91; we observed the highest accuracy (0.97) for chicken (Figure 2, panel B; Appendix 2 Figure 4, panel B). In addition, the accuracy of each class increased, and all class accuracies were >0.50 except for game (0.16) and dairy (0.45).
Model Prediction of Human Data
Figure 3
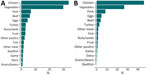
Figure 3. Predictions from a random forest model of sources of US human illnesses among patients without reported history of international travel who had whole-genome sequenced Salmonellaisolates reported to the…
Among all patients without a reported history of international travel and with unknown source of infection, the most common predicted sources of illness were chicken (n = 2,170 [34%]) and vegetables (n = 1,924 [30%]). All other sources accounted for <10% of illnesses (Figure 3, panel A). When we assigned human isolates with a maximum predicted probability of <0.50 as from an unknown source, 44% of isolates (n = 2,859) were labeled unknown. There is more confidence in the predictions with prediction probabilities >0.50 that are retained (i.e., not reclassified as unknown) and are likely to arise from majority classes (such as chicken or vegetables) as opposed to minority classes as observed in the training data (Appendix 2 Figure 5). Among isolates assigned to a known source, 46% (n = 1,694) were predicted to be from chicken, 27% (n = 987) were predicted to be from vegetables, and all other sources of illness accounted for <10% of illnesses (Figure 3, panel B). In addition, the most common predicted source of serotypes Salmonella Enteritidis, Typhimurium, Heidelberg, and Infantis was from chicken. The most common predicted source of Salmonella Javiana and Newport was vegetables, and the most common source of Salmonella 4,[5],12:i:- was pork (Appendix 1 Table 3).
Our study developed a random forest model by using Salmonella wgMLST data from food sources to estimate the likely source of sporadic human illnesses. When using all isolate predictions, the model had >74% accuracy when both out-of-bag and train-test validation methods were used. When we restricted analysis to isolates with prediction probabilities >0.50, the out-of-bag accuracy increased to 91%. Chicken and vegetables were the most common predicted sources of salmonellosis in the United States. This result is consistent with previous analyses; however, our analysis found chicken to be linked to a substantially higher percentage of illnesses than in recent attribution estimates for poultry products on the basis of outbreak data (46% vs. 17%) (6). There are numerous possible reasons for this difference. One possible explanation might be that outbreak data reflect foods as consumed (which can become contaminated from another food during preparation), whereas the data in this study are from earlier points in the farm-to-fork continuum. Another explanation might be that risks associated with outbreaks differ from those associated with sporadic infections. By using our single model, we were able to estimate the contributions of sources to human salmonellosis overall and for serotypes that commonly cause human illness. We found notable differences in attribution across serotypes; we found that chicken was the most common estimated source of Salmonella Enteritidis, Typhimurium, Heidelberg, and Infantis, pork was the most common source of Salmonella 4,[5],12:i:-, and vegetables were the most common source of Salmonella Javiana and Newport.
In our approach, we assigned human isolates from a single source that were attributed to a category with >0.50 probability to that food category. We classified human isolates with <0.50 probability of attribution to any single source as either attributed to an unknown food or a nonfood source. We chose a cutoff of 0.50 by examining the accuracy of predictions by probability, considering that not all illnesses arise through foodborne transmission, and for ease of explanation (i.e., those with >0.50 probability were more likely than not to have come from that source). This approach could be tailored to adjust the sensitivity and specificity of the model for different purposes.
Without this prediction threshold, we estimate that about two thirds of human salmonellosis are attributable to chicken (34%) or vegetables (30%). With the prediction threshold, we retain only confident model predictions and estimate chicken and vegetables as the source of roughly 73% of salmonellosis cases. Moreover, cases were attributed to all 15 modeled categories, indicating that illnesses likely arise from various sources, which is consistent with a recent report of foodborne illness attribution from the Interagency Food Safety Analytics Collaboration (6).
Since routine WGS on Salmonella isolates began in 2019, we are better able to develop and explore new approaches for source attribution estimation. Similar studies in Europe and Australia have used core-genome multilocus sequence typing (cgMLST) and single-nucleotide polymorphism data to attribute certain Salmonella serotypes to animal reservoirs. Results from a logit boost algorithm on cgMLST data from animals estimated 53% of Salmonella Typhimurium’s sources in Denmark with 93% accuracy (13). Results from a Bayesian source attribution model using Salmonella Typhimurium cgMLST data in England and Wales attributed 60% of human cases to pigs (22).
One limitation of our model is that the training data were imbalanced; chicken represented the clear majority class. Subsequently, we then randomly selected a 50% subset to reduce the dataset, and all minority class isolates (i.e., nonchicken sources), which had been filtered out, were reincorporated. As a result, the input data was less imbalanced because the majority chicken class was reduced to only 31%. We also used a cost-sensitive learning approach through inverse class weighting scheme to handle the remaining class imbalance, which applies a heavier penalty on misclassifying the minority classes during model development. Given those steps, our model still predicts chickens as the dominant source in the test dataset of human isolates (>31%). Access to and incorporation of more isolates from nonchicken food categories would likely strengthen the model’s accuracy and precision. In addition, healthcare-seeking behaviors, access to health services, and other characteristics of the FoodNet surveillance area population might not reflect those of the entire United States and might limit the generalizability of our findings. The human isolates included in this analysis were a subset of FoodNet isolates that had wgMLST analysis performed and might not have been equally distributed across the FoodNet sites, which might also limit generalizability. Not all salmonellosis is foodborne; recent estimates indicate that 66% of all salmonellosis cases are from direct consumption of a contaminated food item (foodborne), and we only included food isolates in our training data (23). Including additional training data from nonfood sources, such as water, wild and domesticated animals, and the environment, could expand our estimation to also predict nonfood sources of infection as well. Food animals can contaminate the environment and indirectly contaminate vegetables and fruits and potentially make humans sick. Further, our approach does not distinguish where in the farm-to-fork continuum exposure occurred, and those food sources are not necessarily tied to consumption. Consequently, our model ascribes isolates to sources that might not actually be the source of a foodborne exposure.
Overall, our model predicted chicken and vegetables are top sources of salmonellosis cases in the United States. This analysis highlights the utility of applying classification algorithms, such as random forests, to analyze genomic data for foodborne illness source attribution. With further research, models like ours could be leveraged with existing genomic surveillance systems to support source identification in outbreak investigations and to help inform regulatory priority setting processes.
Dr. Rose is an epidemiologist in the Predict Division of CDC’s Center for Forecasting and Analytics. Her research interests include the surveillance and analytics of respiratory viruses and foodborne illnesses. Dr. Steele is an epidemiologist in the Division of Foodborne, Waterborne, and Environmental Diseases in CDC’s National Center for Emerging and Zoonotic Infectious Diseases Her research interests include infectious disease dynamics and estimating the prevalence of disease and the effects of public health interventions.