



Disclaimer: Early release articles are not considered as final versions. Any changes will be reflected in the online version in the month the article is officially released.
Author affiliation: University of Utah, Salt Lake City, Utah, USA (E. Warren, J. VanDerslice, L.S. Benson, W.J. Brazelton, W. Tanner, S. Fusco, J. Weidhaas); Centers for Disease Control and Prevention, Atlanta, Georgia, USA (F. Whitehill, A. Coulliette-Salmond); US Public Health Service, Rockville, Maryland, USA (A. Coulliette-Salmond)
Antimicrobial-resistant infections caused >35,000 deaths in the United States (1) and 1,270,000 deaths worldwide (2) in 2017; US costs exceeded $13.5 billion (1). By 2050, antimicrobial resistance (AMR)–related deaths are projected to rise by 70%, to >208 million (3). Among the Centers for Disease Control and Prevention–classified urgent threats are carbapenem-resistant Enterobacterales (CRE), which are responsible for ≈13,100 hospital-associated infections in the United States annually (1). Intermediate and long-term acute care facilities are particularly vulnerable to CRE because of high transmission risk and limited treatment options for antimicrobial-resistant infections (4).
Routine patient surveillance for infection and colonization by antimicrobial-resistant pathogens is costly (5) and invasive (6), whereas monitoring hospital wastewater offers a nonnvasive, cost-effective alternative (7,8) that captures signals of AMR from large patient populations, including colonized persons. Multiple studies have attempted to correlate wastewater AMR genes with infections or hospitalizations in associated communities (9–11), although few were longitudinal studies (12–14). One notable study detected a blaNDM-producing CRE in hospital wastewater that matched a patient isolate (12), whereas another found blaCTX-M wastewater concentrations were reflective of the patient population (11).
Carbapenem-resistant infections are a growing threat in healthcare settings, highlighting the need for practical surveillance methods to detect outbreaks early. Wastewater surveillance might be such a solution, although sampling techniques might influence wastewater gene concentrations. To address those concerns, we monitored 5 carbapenemase genes of clinical concern (blaKPC, blaVIM, blaOXA-48-like, blaNDM, and blaIMP) (15) in wastewater from a rehabilitation hospital over 16 months. We collected samples weekly, twice weekly, or monthly using composite, passive, and biofilm-based methods and analyzed them by quantitative PCR (qPCR), metagenomics, and culturing. We evaluated sampling method, hold time, and storage temperature to determine their effects on data reliability; we focused on inexpensive and simple approaches suitable for facilities without nearby diagnostic laboratories. By examining trends in carbapenemase gene abundance, we aimed to establish a baseline of carbapenemase genes for the facility and evaluate whether those trends correlated with clinical infections.
This study used deidentified patient data correlated with wastewater samples. The University of Utah Institutional Review Board determined the protocol to be exempt under Category 4 of 45 CFR 46.101(b) (protocol no. 00177673; exemption date November 26, 2024). All samples were handled in accordance with biosafety precautions.
Site Description and Wastewater Parameters
We collected sewer samples from a 5-story rehabilitation hospital with multiple wards in Utah, USA; no other wastewater sources contributed to the flow. With a staff of ≈140, the 75-bed facility provides inpatient and outpatient care (600 outpatient clinical visits per month) and food services. Inpatient care was estimated to contribute 48% of water use, outpatient care 2%, staff 14%, and food services 36% (16). Daily visitor count was not known. We confirmed wastewater travel time from various facility floors by flushing dye (Bright Dyes tablet tracer dyes, Kingscote Chemicals, https://www.kingscotechemicals.com) and visually monitoring wastewater in the sewer manhole for arrival of the appropriate dye, as previously reported (17).
Limits of Detection of Antimicrobial-Resistant Genes and Cultures in Composite Wastewater
In brief, we serially diluted bacterial cultures with carbapenemase genes in wastewater (n = 5 for each dilution, n = 3 trials per gene). We then processed samples according to standard methods (Appendix) and determined the viable culture and qPCR gene copies (GC) per milliliter for each dilution.
Wastewater Methods
Sample Collection and Processing
We compared 3 sampling methods (Table 1): composite wastewater collected using a peristaltic sampler (Hach, https://www.hach.com) collected over 24 hours (n = 297), passive absorptive samples (tampons) typically deployed for 24 hours except when field conditions did not allow for 24-hour collection (n = 110), and sewer biofilm swabs (World Bioproducts, https://www.worldbioproducts.com) from the periodically wetted area of the sewer pipe above the flowing wastewater (n = 32) (Appendix). We desorbed bacteria from passive samplers and biofilm swabs by vortex at maximum speed for 10 minutes in 1X phosphorus-buffered saline (PBS) (Thermo Fisher Scientific, https://www.thermofisher.com). We added a spike-in recovery control to all samples (Zymo Research, https://www.zymoresearch.com). We precipitated bacteria by adding polyethylene glycol 6000 and 0.9% of NaCl, shaking (80 RPM), centrifuging (typically 10 minutes at 31,400 × g), and resuspending in 1X PBS. We subsampled the resuspended pellet for culturing by using MacConkey I (Avantor, https://www.wvr.com) and CHROMagar KPC agar (DRG International, https://store.drg-international.com), analyzed by using GeneXpert Carba-R (Cepheid, https://www.cepheid.com), and extracted DNA (18) for qPCR (19–21) and metagenomics (Appendix).
Comparison of Sample Volume, Handling, and Storage
We investigated the effects of concentrating 40 mL or 500 mL of sample for gene abundance. The treatments compared 40-mL samples centrifuged at 2 different speeds and times with 500-mL samples (Table 2). We tested those speeds and temperatures with the understanding that not all laboratories have access to high-speed, temperature-controlled centrifuges. After centrifugation, we extracted nucleic acids from the samples (Appendix). We used 1-way analysis of variance (ANOVA) using SigmaStat software version 14.5 (Grafiti, https://grafiti.com) with p
We evaluated the effect of sample handling conditions, including hold time, temperature, and processing stage, on gene abundance in 5 treatment types, each with >2 replicates. We concentrated samples using polyethylene glycol centrifugation and resuspension in 1X PBS as described in the previous section. Samples processed immediately served as controls (Table 2). We compared controls with samples held for different days and temperatures before performing concentration and nucleic acid extraction with and without preservation with 1:1 50% glycerol:10 mM 2-amino-2-(hydroxymethyl)propane-1,3-diol (Tris). We used a general linearized model to determine the effect of sample handling and storage conditions on gene abundance (Appendix).
Wastewater Trends and Alignment with Facility Patient Testing Data
The facility provided monthly average patient census, carbapenem days of therapy, numbers of patients screened for carbapenem-resistant organisms (CRO), numbers of infections with carbapenemase-producing organisms, percentage of patients that were independently performing all steps of toileting and showering, infected patient admission and discharge dates, and building water use. Composite, passive, and sewer biofilm samples were collected weekly during January–December 2023 and then twice monthly during January–April 2024 (Table 1). We determined carbapenemase gene composition in samples by qPCR and Carba-R analysis. We determined total bacteria by quantifying the conserved region of the 16S rRNA gene (Unibac primers) (25). We adjusted carbapenemase gene abundance by qPCR for Zymo recovery and log10 transformed or normalization by 16S rRNA GC or wastewater flow (Appendix).
We conducted Spearman rank order correlations of carbapenemase gene detections by method and multivariate linear regressions among antibiotic-resistance gene (ARG) abundance in SAS version 9.4 (SAS Institute Inc., https://www.sas.com). We used a nonparametric regression technique to smooth scatter plots of ARG over time using PROC LOESS in SAS with smoothing parameters from 0.1 to 0.25.
Limits of Detection of Antimicrobial-Resistant Genes and Cultures in Composite Wastewater
Figure 1
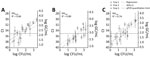
Figure 1. Measured Ct (mean +SD), calculated log GC/mL, and extrapolated log CFU/mL for detection limit studies in study of detection methods for wastewater surveillance of antimicrobial-resistant bacteria from healthcare…
The detection limits of blaNDM, blaVIM, and blaIMP in 40 mL of wastewater was 146–5,486 GC/mL with average and SDs of 3 trials (Table 3). We observed variations in cycle threshold (Ct) values for the different dilutions (Figure 1; Appendix).
Wastewater Methods
Comparison of Composite, Passive and Biofilm Sampling Methods
The blaKPC, blaVIM, and blaOXA-48-like GC normalized by water usage showed a strong correlation among composite wastewater and passive samples (Spearman ρTable 4; Appendix Figure 1, whereas blaNDM and blaIMP were not correlated. In biofilm samples, blaOXA was correlated with passive samples and with blaKPC. We observed inverse correlations between blaKPC in biofilms and blaVIM in passive samplers but only in 7 samples, thus decreasing the power of the analysis. Regardless of method, fewer gene concentrations were correlated when the data were not water usage–normalized (Appendix Table 5, Figure 2). When normalized to facility water usage, sewer biofilm qPCR concentrations correlated with composite wastewater samples. Deployment of passive samplers for >24 hours (n = 29) was shown to increase only total bacteria (i.e., conserved region of 16S rRNA gene) and blaKPC (p+1.5 day, [average + SD]), but R2 values were all Appendix Figure 3).
We correlated CHROMagar KPC and MacConkey I culture counts in passive or composite samples for E. coli, Pseudomonas spp., and Acinetobacter spp. (Appendix Tables 6, 7). Metagenome sequencing revealed a wide range of ARGs (Appendix Figure 4), including detection of bla genes in all sample types (Appendix Figure 5). All target bla genes were detected in the metagenomes of >1 sample (Appendix Figure 4). Passive samples had more blaKPC (Appendix Figure 5) than the biofilm and grab metagenomes, which had very low abundances (1–5 transcripts/million [TPM]). The blaVIM gene was most abundant (14 TPM) in the biofilm metagenome. Neither blaNDM nor blaOXA-48-like genes were detected in any metagenomes, despite detection by qPCR. We examined the relationship between metagenomic sequence coverage and qPCR abundance (Appendix Figure 6) and found a significant correlation for blaKPC (R2 = 0.66). In contrast, blaVIM was only detected in 1 of 3 metagenomes, where the qPCR abundance was 4 log10 GC. The blaOXA-48-like abundance was 2 to 6 log10 GC and the blaNDM abundance was 10 GC, but they were not detected in metagenomes. Therefore, the absence of blaOXA-48-like and blaNDM genes in the metagenomes is surprising but reasonable because of the limits of detection for metagenomic sequencing.
We sequenced and classified 7 isolates from composite wastewater in January 2023 as Citrobacter, E. coli (1 isolate; serotype O8 + H19), and Providencia (1 isolate). Of 12 isolates sequenced and classified in October 2023, 6 of 12 were also Citrobacter, 3 were Comamonas, and 3 were Aeromonas. The Aeromonas and Citrobacter isolates had similar ARGs (Appendix Figure 7), including blaKPC-2, blaKPC-3, blaOXA-2, blaTEM-1, and blaSHV. The E. coli genome includes blaCTX-M-15, blaEC, and blaTEM-1.
Comparison of Carbapenemase Gene Detection Methods
Among all samples and collection methods, there was close agreement between the Carba-R assay and qPCR detections (Appendix Tables 10–12); 551 (85.4%) of 645 replicate carbapenemase gene assay results were either both present or both absent. The blaVIM gene was more frequently detected by Carba-R assay than by qPCR; 76 (58.9%) of 129 samples were positive by Carba-R but negative by qPCR. The blaIMP gene was not detected by Carba-R, whereas 7% (5/69) of samples were qPCR positive.
Comparison of Composite Wastewater Sample Volume, Handling, and Storage
We conducted studies to evaluate the effect of wastewater sample volume, sample concentration method, and sample handling methods on ARG abundance. In the first study of wastewater sampling volumes, we found no significant difference (p>0.05 by Dunn method) in gene abundance among 2 40-mL samples centrifuged at different speeds (31,400 × g or 3,400 × g) and times (10 or 60 minutes); therefore, we combined those data for further analysis. Overall, 40-mL samples had a significantly higher mean abundance than the 500-mL samples for blaVIM (pblaOXA-48-like (p = 0.01 by ANOVA on Ranks), but not for blaKPC (p = 0.1 by ANOVA) (Appendix Figure 8). Therefore, we used 40-mL samples with centrifugation at 31,400 × g for 10 minutes.
Figure 2
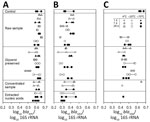
Figure 2. Holding time and preservation temperature comparison for log10 blaKPC (A), blaOXA-48-like (B), and blaVIM(C) measured by quantitative PCR in…
We compared sample holding times (1, 7, and 29 days), holding methods (concentrated before storage or not), and preservation methods (raw sample or glycerol preserved) with samples extracted and analyzed immediately to determine how sample handling influenced ARG abundance (Table 5, Figure 2). Sample preservation method (Table 5) generated the most variation in gene abundance. Specifically, the sample preservation method accounted for 24%–42% of the variation in GC per milliliter. The highest recovery was observed in concentrated samples (57%–121% average recovery of ARG among all temperatures and times) or extracted nucleic acid samples (59%–94% recovery). Sample hold time before handling accounted for 25% to 38% of variability. Hold time significantly influenced ARG abundance (Table 5); shorter hold times are recommended.
Wastewater Carbapenemase Gene Trends and Alignment with Facility Clinical Infections
During the 16-month study, only 5 CRO clinical infections were identified in 4 patients within the facility. Infections 1 and 2 were identified as Klebsiella (Enterobacter) aerogenes and Enterobacter cloacae, isolated from urine specimens collected 9 days apart in April 2023 from the same patient; both were negative for carbapenemase genes. Infection 3 was a carbapenem-resistant Pseudomonas aeruginosa (CRPA) from a wound in April 2023, which was not tested for carbapenemase genes. Infection 4 was a case of CRPA from a urine specimen in December 2023, also not tested for carbapenemase genes. Infection 5 was determined to be Escherichia coli and Citrobacter freundii and came from a perianal screen in March 2024; it was not tested for carbapenemase genes. Of note, the patient with CRE identified in urine specimens in April 2023 used ostomy bags, which might not have been disposed of in the toilet. All other patients were recorded as toileting by nurses. Carbapenem antibiotic use in the facility was documented (Appendix Table 13).
Over 16 months (Tables 6, 7), blaKPC and blaOXA-48-like were detected in >98% of composite and passive samples, but blaVIM, blaNDM, and blaIMP were detected less frequently (35% in composite and 31% in passive for blaVIM, 10% in composite and 9% in passive for blaNDM, 3% in composite and 9% in passive for blaIMP). All sewer biofilm samples contained blaKPC and blaOXA-48-like, but only 24% of samples contained blaNDM and blaVIM, and 18% contained blaIMP (Table 8).
Figure 3
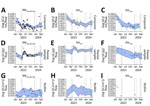
Figure 3. GC of blaOXA-48-like, blaKPC, and blaVIMin wastewater collected by autosamplers, passive samplers, or swabs of sewer biofilm in study of detection…
Abundance of blaKPC and blaOXA-48-like, normalized for facility water usage, increased after April 2023 when CRE- and CRPA-infected patients were present (Figure 3). A general increase in blaKPC and blaOXA-48-like abundance was also observed in the last 4 months of the study period (Figure 3, panels A, B, D, and E), although that increase was not attributable to a patient infection. The blaVIM abundance generally decreased over the study period for flow-normalized and nonnormalized data (Figure 3, panels G, H, I; Appendix Figure 9). The low incidence of CRO infections (5 over 16 months) and lack of confirmed carbapenemase-producing CRE infections precluded modeling of relationships between wastewater carbapenemase gene abundances and clinical infection occurrence.
This study standardized methods for carbapenemase gene detection in hospital wastewater. Sample handling conditions significantly affected gene abundance measurements. Gene recovery was highest when 40 mL of sample was processed using a higher centrifuge speed, compared with 500 mL processed at lower centrifugation speeds. Recovery decreased with prolonged storage or higher temperature unless samples were preserved with glycerol. Those findings emphasize the importance of standardized, practical protocols (22). Our results demonstrate that passive sampling is as effective as composite sampling, as suggested by others (23), and that storing raw samples at 4°C up to 29 days was comparable to immediate processing. That finding is especially relevant for resource-limited settings, because those facilities can collect and store a passive sample before processing in lieu of composite samples processed the next day.
Over 16 months, 2 carbapenemase genes, blaKPC and blaOXA-48-like, were consistently detected by qPCR and Cepheid Carba-R assays in each of the 3 collection methods. Among sampling strategies, the composite and passive sampling outperformed biofilm sampling in terms of gene richness and antimicrobial-resistant gene detection frequency. Passive samples also yielded higher concentrations of carbapenemase genes. The sewer biofilm gene concentrations when normalized to building water usage was correlated with wastewater concentrations, suggesting the sewer biofilm might influence the wastewater carbapenemase gene abundance, but additional studies are needed to elucidate that relationship. Differences in gene abundance between sewer biofilms and composite samples might reflect shedding from colonized patients, environmental persistence, or microbial community dynamics.
Temporal trends of gene abundance in wastewater were not correlated with patient infections because of the limited clinical infections during the study. Longer-term sampling is required to evaluate the utility of wastewater surveillance as a complement to hospital AMR surveillance methods. Two critical points require further consideration: first, wastewater results should be interpreted considering reservoirs for antimicrobial-resistant bacteria, such as sinks and sewer biofilms, which were found to harbor carbapenemase genes (Appendix Figure 5) and CRE as reported elsewhere (24,25); and second, CRE or carbapenemase gene sources in addition to infected patients such as colonized patients, hospital staff, outpatients, and visitors should be considered. Additional research is needed to investigate the contribution of sewer biofilms to wastewater from hospitals, because those biofilm signals might confound temporal gene signals. Identifying the nonpatient contribution of CRE or carbapenemase genes to wastewater will also be critical for successful surveillance efforts.
Because of the limited clinical infections during the study period, it remains an open question whether wastewater surveillance might enhance outbreak detection, support infection control, and aid antibiotic stewardship, and additional study is needed. Further, the contribution of sewer biofilms to wastewater signals needs investigation. In conclusion, wastewater sampling, particularly composite and passive methods combined with sensitive molecular detection, might be a practical, noninvasive approach for monitoring carbapenemase genes in healthcare facilities, as demonstrated by other reports (26,27). Passive sampling might be suitable in low-resource settings, situations with space constraints, or situations in which sewer access is limited.
This article was preprinted at https://www.biorxiv.org/content/10.64898/2025.12.14.694051v1.
Mr. Warren is a PhD student in environmental engineering at the University of Utah and for 25 years was a research hydrologist at the US Geological Survey. His primary research interests are novel community health-related biomarkers for wastewater surveillance.
We thank Sophia Reyes, Nathan Hatten, Aspen Dalby, Daniel Jeun, Katherine Reilly, Vivian Marcoux, and the Utah Public Health Laboratory for their valuable assistance.
This work was supported by CDC contract no. 200-2021-12774, Safety and Healthcare Epidemiology Prevention Research Development (SHEPheRD), 2022 Domain 1-A004: Wastewater surveillance approaches for antimicrobial resistant genes and organisms in healthcare settings within the Western US Region, Jennifer Weidhaas, PhD (Civil and Environmental Engineering), Principal Investigator. This work was also supported in part by a first-year fellowship to E.W. from the University of Utah Global Change and Sustainability Center.
J.V., S.B., W.B., W.T., A.L., F.W., A.C.-S., and J.W. conceptualized the study. J.V., S.B., W.T., A.L., F.W., A.C.-S., and J.W. acquired funding. J.V. and J.W. performed project administration. E.W., S.B., W.B., and S.F. curated data. E.W., W.B., and J.W. conducted the formal analysis. E.W. and S.F. were investigators. E.W., W.T., and J.W. constructed the methodology. E.W. and J.W. conducted visualization. E.W. prepared the original draft, and J.V., S.B., W.B., W.T., A.L., F.W., A.C.-S., and J.W. performed review and editing. J.W. supervised the study.